BC affordability · inflation · money supply · source-check · 2026-08-29
Canada’s M2 money supply is near $2.84T — but one viral chart does not explain every grocery or housing bill
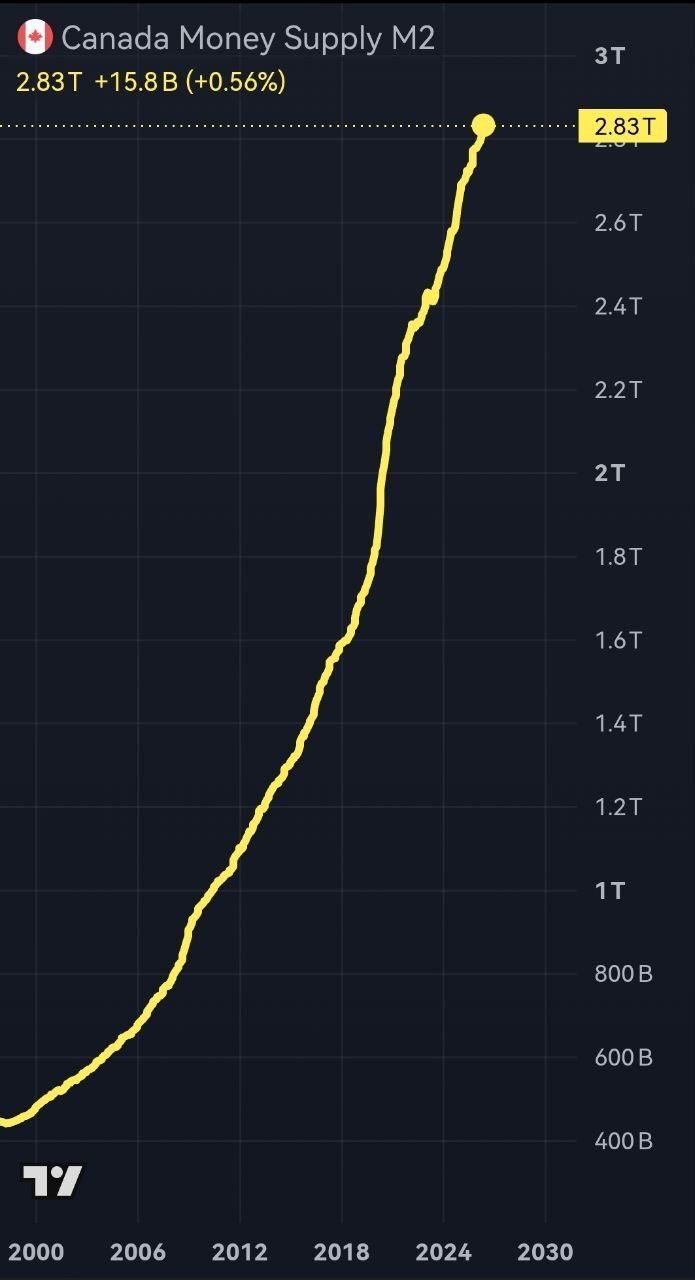
An X post from Erik Thorvaldsson shows a TradingView-style chart of Canada’s M2 money supply and argues the country created “six times more dollars” without creating six times more oil, lumber or food. NewsForBC checked the money-supply number against Bank of Canada/Statistics Canada data, then separated that real signal from the post’s broader affordability conclusions.
Original X postSource noteClaim tableCaptured chart
What the X post claims
Canada’s M2 just hit $2.83 trillion. That’s nearly 6× what it was in 2000. They didn’t create six times more oil, six times more lumber, or six times more food. They created six times more dollars. Your wages didn’t 6×. Your grocery bill did. Your house payment did. Your kids’
The image itself reads “Canada Money Supply M2” and shows a latest value around 2.83T. The caption then turns that chart into a broader argument about inflation, wages, groceries and housing affordability.
What the official money-supply table says
Statistics Canada table 10-10-0116, sourced from the Bank of Canada, lists monthly monetary aggregates in millions of dollars. For M2 gross, NewsForBC calculated:
- 2000-01: $478,778 million, or about $478.8 billion.
- 2026-06: $2,840,155 million, or about $2.840 trillion.
- Change: about 5.93×.
That means the “nearly 6× since 2000” statement is broadly supported for M2 gross, depending on the exact month and whether one uses M2, M2+ or M2++.
Where the post goes too fast
Money supply growth matters. It affects credit, deposits, asset markets and inflation pressure. But it is not the same thing as saying every household cost rose by exactly the same multiple.
The Bank of Canada inflation-calculator CPI series shows all-items CPI moving from 93.5 in January 2000 to 169.9 in 2026-07-01, about 1.82×, or roughly 82% higher. Food, rent, mortgages and B.C. home prices need their own category-specific calculations.
Why B.C. readers feel this anyway
Even if all-items CPI did not rise sixfold, many B.C. households have felt a deeper affordability shock than the national CPI line suggests. Housing, mortgage renewals, insurance, property taxes, groceries and transportation do not rise evenly for every family. A young buyer in Metro Vancouver, the Fraser Valley or parts of Vancouver Island can face a very different inflation story than a national average.
So the post is useful as a prompt: Canada’s money and credit system has expanded massively since 2000. The next step is to ask better questions — which prices rose most, which incomes lagged, and which policies made B.C. housing and essentials more expensive.
Claim table
| Claim | Status |
|---|---|
| Canada M2 has hit about $2.83 trillion. | Mostly supported. Statistics Canada table 10-10-0116 / Bank of Canada monetary aggregates show M2 gross at 2.840 trillion dollars in 2026-06; the X chart rounded to about $2.83T. |
| M2 is nearly six times what it was in 2000. | Supported depending on start month and aggregate. M2 gross was 478.8 billion dollars in 2000-01 and 2.840 trillion in 2026-06, a 5.93× increase. |
| Canada did not create six times more oil, lumber or food. | Rhetorical claim not checked as a literal production calculation in this pass. Real output, population, productivity, imports, credit and asset markets all have to be measured separately. |
| Your wages did not increase 6×. | Likely directionally true for many workers, but not quantified in this pass from a wage table. The article treats this as a records-wanted wage comparison. |
| Your grocery bill did increase 6×. | Not proven by all-items CPI. Bank of Canada inflation-calculator CPI rose from 93.5 in Jan. 2000 to 169.9 in Jul. 2026, about 1.82× overall. Food-specific CPI and household basket choices need separate checking. |
| Your house payment did increase 6×. | Not proven as a national claim in this pass. House payments depend on local prices, down payment, mortgage rate and renewal timing; B.C. households may have experienced severe housing inflation, but a 6× payment claim needs scenario math. |
| Money supply growth alone explains affordability. | Too simple. Money/credit growth matters, but prices are also affected by supply constraints, taxes, energy, global commodity markets, immigration/population growth, interest rates, zoning and productivity. |
Editor’s note
This is a source-check, not a defence of inflation or government policy. NewsForBC is preserving the post because it raises a real affordability question. The key distinction is between a verified money-supply increase and unverified one-line explanations for every household cost.